I got 4.5 Million MSDF glyphs showing on Mac M1, using Instancing, why initial memory usage is high, compared to the expected amount?

I was trying to figure out how to render text using MSDF and SDL3 GPU. I’m glad so many great resources exist, and so much research has been done on the subject.

I got it to work, however I’m unsure why initially memory jumps to such a high number, while entering 4.5 million characters into the input field.

I know micro bench-marking is useless, but just wanted to apply what I learnt from my bunnymark experiment on instancing. Also, without this, I was only able to get 500 characters to show up on screen.

I have turned off resource cycling, so new data doesn’t have to pushed every frame, I just push to GPUBuffer only when input field changes, and also I fill up the SSBO only on change.

Here’s the SSBO / Structured Buffer:

Vec4 :: [4]f32
Mat4 :: matrix[4, 4]f32

SSBO_Font_Local :: struct {
	model_mat  : Mat4,
	uv_rect    : Vec4,
	plane_rect : Vec4,
}

32 * 24 = 768 Bits = 96 Bytes per glyph

4,500,000 * 96 Bytes = 432000000 Bytes = 432 MB

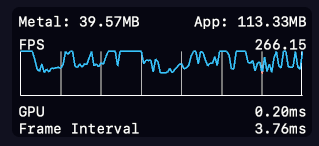
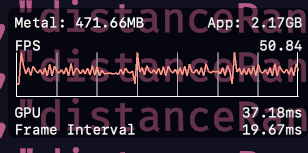
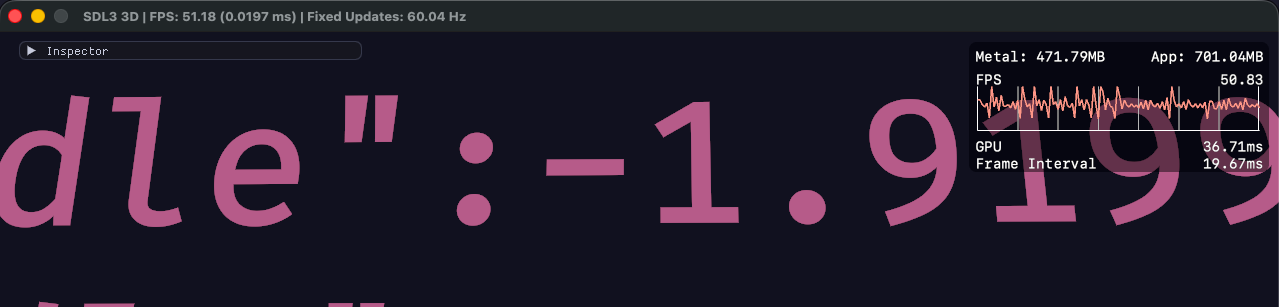
I see App memory usage jump up to 2.58 GB, then down to 1.3 GB, before settling down at 566 MB.

Why does this jump happen?


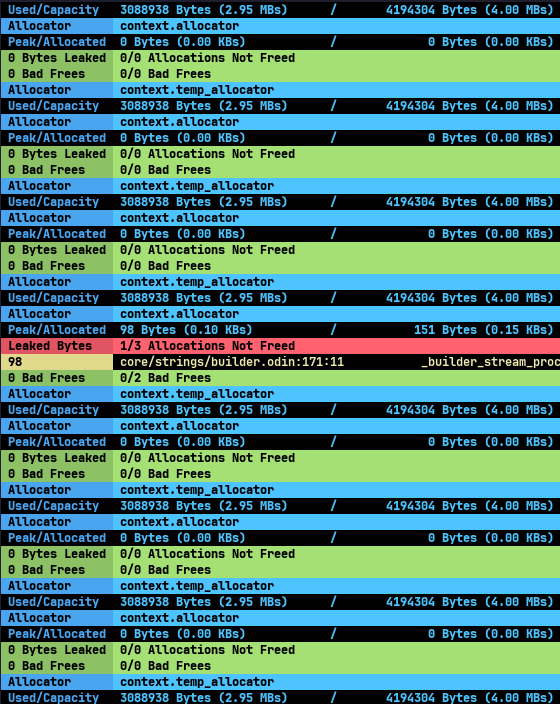
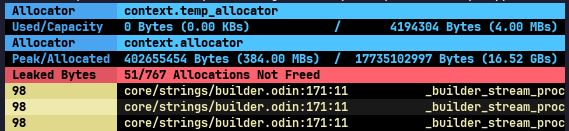
Here’s the memory usage, before I enter the text using Dear Imgui:


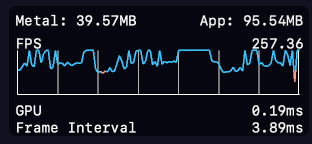
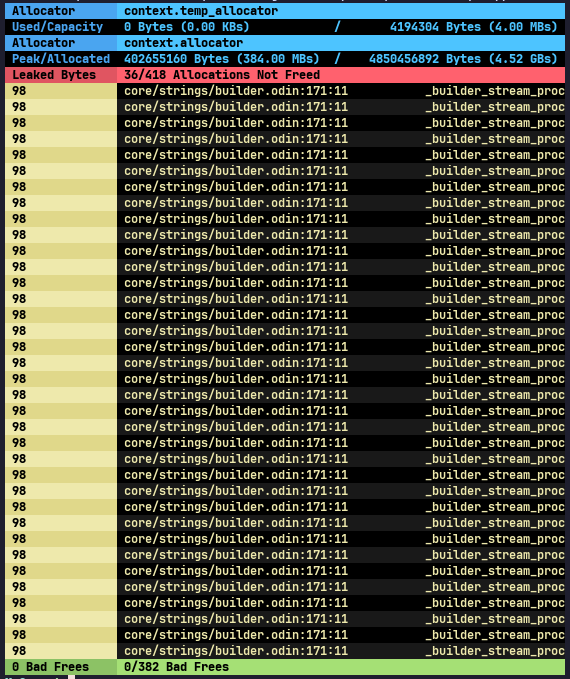
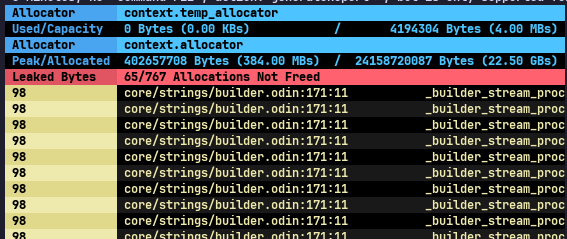
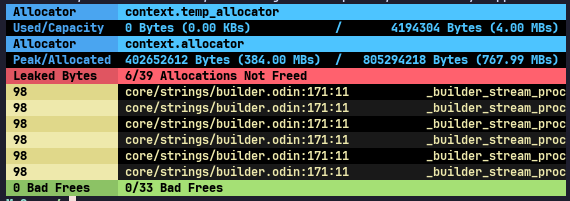
And here’s after I clear the text: (I’m messing up the string builder or cstring conversion, which results in memory not being free, still investigating.)

Are you pasting all 4.5 million characters into the field at once? Have you tried cutting it into 4ths, 5ths, etc, and successively pasting each separately to see how it behaves? Maybe some sort of speculative memory allocations are happening based on the rate of input?

Otherwise, without seeing the code, one could only speculate :wink:

1 Like

I did it in batches, and it behaves the same.

10k, 20k, …

That’s how I discovered the current limit of the code.

I’m piecing together a game engine, so the code is not separated cleanly. Still figuring things out as I go.

So, I will refactor and paste whatever matters. Give me some time. :sweat_smile:

For the SB to cstring memory leaks, surely you are using a tracker to find those?

2 Likes

Not yet. I was thinking about adding it, but kept on delaying because of distractions.

I will add it tomorrow, thank you.

If you have my afmt library, you can also have a pretty colorized tracker :slight_smile:
tracker

import "shared:tracker"

// tracker imports this and needs it to exist
// your project does not need it if not printing with afmt
import "shared:afmt"

main :: proc() {
	when ODIN_DEBUG {
		//tracker.NOPANIC = true // uncomment or override with: -define:nopanic=true
		t := tracker.init_tracker()
		context.allocator = tracker.tracking_allocator(&t)
		defer tracker.print_and_destroy_tracker(&t)
	}
	
	// ... stuff and things ...
}
2 Likes

Yes I saw your library. I will give it a try.

Hello @xuul,

I checked out your library, it works great in wezterm, but in Sublime text build terminal, it breaks, it doesn’t support color output I guess.

I loved the color choices, they really pop and are easy to parse. Thank you for the library.

This is placed inside the loop:

This is in main:

:person_facepalming:

If I add text to the input field in batches of 10k, 10k, …, 100k, 100k, … 1m, …:


After I delete the text, in this case the memory usage settles at higher MB.


If I add 4 Million characters at once:

After I delete the text, in this case, the memory usage settles at 115 MB.


I am fudging up string builder usage.

Game_State :: struct {
    input_buf: [4_500_000]u8,

    builder: strings.Builder
}
init :: proc() {
    copy(g.input_buf[:], "Paste Here ...")

    g.builder = strings.builder_make(context.temp_allocator)
}
if im.InputText("Input: ", cstring(&g.input_buf[0]), 4_500_000) {
    g.input = string(cstring(&g.input_buf[0]))
}

strings.builder_reset(&g.builder)
strings.builder_destroy(&g.builder)

g.builder = strings.builder_make(context.temp_allocator)

strings.write_string(&g.builder, g.input)

str := strings.to_string(g.builder)

Seems you were right about thinking maybe you had an issue with string builder allocations.

The fact that batches produces more leaks than the all-at-once, tells me the problem is likely from allocations made when initializing the builder. Each time a new batch comes in, a new builder is allocated, and then not cleaned up. Does it pass it off to something else, a clone perhaps? That may be the place to delete the builder.

1 Like

The library does respect the NO_COLOR environment variable through Odin’s core:terminal ‘terminal.color_enabled’ bool. If NO_COLOR is set to anything other than an empty string, ANSI color is not applied, but attributes like bold, italics, etc, are still allowed to pass through.

1 Like

I have updated the previous post with some code snippet.

I tried NO_COLOR=1, but I got this:

MTL_HUD_ENABLED=1 MTL_HUD_CONFIG_FILE=hud/fps-graph.plist NO_COLOR=1 odin run ./src -collection:shared=shared

Yup. Looks like Sublime is rejecting the ANSI sequences. Specifically turning the escape character into a byte value and ignoring it. Nothing I can do about that. The terminal either supports standard ANSI or doesn’t (and sometimes somewhere in-between).

I’ll make a non-ansi version and put it up on git when I get a chance. May not be as easy to scan without color, but you could still have the formatting and metrics.

So back to your problem. I’m a little confused why you are getting leaks in context.allocator when you are using context.temp_allocator for the string builder. I’m missing something.

It’s okay, the sublime text build system terminal can’t show colors but other places it works. Wezterm & Terminus work. (Terminus shows no color regardless of NO_COLO env variable)

And I’m freeing the temp allocator at the start of each frame:

main_loop: for {
  free_all(context.temp_allocator)
  ...
} 

Let me refactor and paste rest of the code.

Plus that’s an arena (basically), so the tracker only shows used memory and capacity for that. Only leaks from context.allocator can be tracked and reported.

Is there somewhere in the code where an allocation is happening because of a default parameter from a core library using context.allocator implicitly, and maybe it’s not obvious because the code does not explicitly supply that parameter.

I will have to check, wherever allocator is mentioned, I explicitly pass one. But I may have missed some places.

I have not yet mastered it, so I used the temporary one everywhere. :sweat_smile:

I wonder about explicitly destroying the builder. When using an arena, which context.temp_allocator basically is (except it’s a special one), it is not usually possible to clear specific allocations in an arena. It’s only free-all or nothing. But if that’s where the problem is, then bad frees should have been triggered.

Edit: I tried destroying the builder when using context.temp_allocator. Seems it is allocator safe (i.e. will only destroy using the allocator if the allocator supports it). I get no leaks by either destroying or not destroying when using context.temp_allocator, since it cleans up on it’s own on exit.

When I’m at this point, I start commenting out code until the leaks disappear. Then I know where to start. Then start reintroducing allocations a little at a time and check for leaks before adding more.

Digging a little deeper, the leaks are referencing “_builder_stream_proc”, which is an internal procedure in strings. Then tracing that in core/strings/builder.odin to the actual procedure that uses it, there is only one, which is “to_stream”. Where in the code is to_stream used?

to_stream also seems to explain why batches of input produce more leaks than an all in one paste. Fewer to_stream usages from the paste all at once.

In the future, I recommend you force yourself to use context.allocator and always have the tracker in your project. It’s best if the tracker is at the top of main, since it replaces context.allocator with the tracker and will catch everything from beginning to end of execution. Check for leaks periodically before adding too much code to keep things sane. This approach worked for me, and I’ve now allowed myself to graduate to virtual arenas :slight_smile:

1 Like

I have cleaned up the code and created a Git repo.

Here it is for your kind perusal:

I will definitely do that. I want to do so much, but can’t do it all at the same time.

List of todos is just huge.